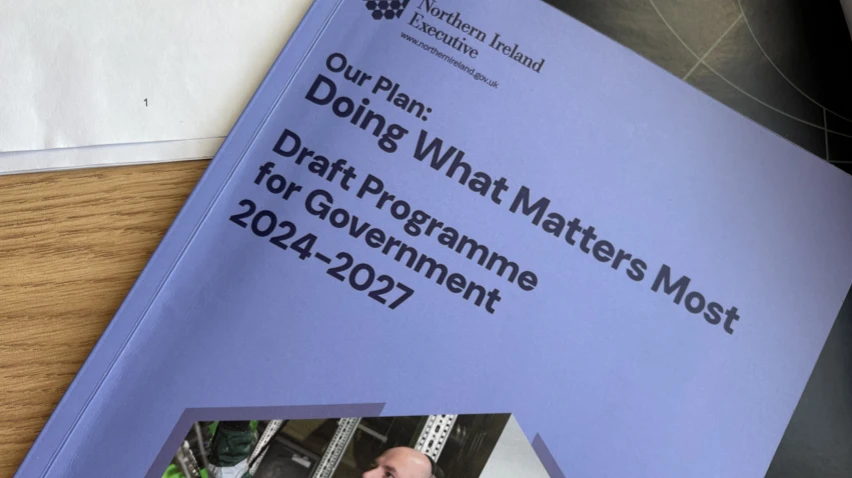
Near the end of the recent annual report into the Programme for Government was a brief look at the Wellbeing Framework, which “provides a long-term view of the various elements that contribute to the wellbeing of our society”.
Within the Framework, there are 52 indicators across ten strategic domains, which are linked to the four Missions of the PfG: People, Planet, Prosperity and Peace. Each of the indicators are updated with new data as it becomes available. All of these indicators can be seen on the Wellbeing Dashboard, which is well presented and easy to use.
Indicators can be broken down by constituency or local government district, as well as a range of section 75 groupings, such as sex, age, religion, disability, ethnic group and sexual orientation. So behind the headline indicators there is a wealth of detailed data available about different groups.
Each indicator can be tracked across a number of years, but also has a comparison year, a target area for improvement, and a threshold for “worsening”. The example below of the ‘river water quality’ indicator shows an example of this:

According to the annual report, 14 out of 52 indicators were improving, 22 were showing no change, 15 were worsening and one did not have sufficient data to be able to assess the change.
Pivotal's analysis
1. Performance against these indicators is concerning
These 52 indicators were selected by the Executive to measure progress on what they considered the fundamental building blocks of wellbeing. It is therefore an important resource to hold ministers to account.
More indicators are worsening than improving. These cut across all ten domains, and include issues like “life satisfaction among young people” which has dropped consistently since 2016, “preventable deaths” which has had a “statistically significant” increase from 173/100,000 in 2016-2020 to 181/100,000 in 2020-24, and “homelessness” which has increased from 10,135 in 2021-22 to 10,855 in 2024-25.
More indicators are showing no change than are improving or worsening. These include “processing times for criminal cases”, relative poverty and the number of journeys taken on public transport. Some of these have shown some positive movement in the last year, but are still not meeting the targets set by the Executive. While trust in the Assembly has increased since it returned in 2024, it is no higher than it was in its comparison year of 2020.
2. There are some signs of progress
14 of the indicators are improving. Greenhouse gas emissions are trending downward, those with possible mental health problems are decreasing, and “skills” (measured as the proportion of the population with 5 GCSEs A*-C) are improving.
The “Stronger Economy” domain shows the most progress of them all, with seven indicators improving, one showing no change, and one worsening.

3. The RAG assessment is useful, but the devil is in the detail
The Wellbeing Dashboard provides a good summary of progress against these domains, and the RAG assessment helps get a picture of this at a quick glance. However, a closer analysis of the indicators in detail is necessary.
As is often the case with public data, some of the indicators use information which is old, sometimes predating the return of the Assembly. The most up-to-date data in the “children’s social care” indicator, which looks at care leavers in education, employment or training, is from 2022-23. Furthermore, although it is considered to be improving (as it is at a higher level than its comparison year), it shows a 7% drop between 2021-22 and 2022-23.

4. The data is interesting, but its connection to PfG priorities is unclear
The Wellbeing Dashboard is a detailed and informative resource, with clear explanations as to how each indicator is measured and what the data tells us. It also provides sources and other related data. It is a positive example of transparent government and its easy-to-understand presentation make it accessible to the public.
However, the PfG states that the Wellbeing Framework fits with its four Missions, but, as Pivotal has previously pointed out, the connection between the Missions and the nine priorities is not clear. While many of the indicators are important, they do not directly connect to the goals set out in the priorities.
There are no indicators, for example, related to Special Educational Needs, hospital waiting lists or childcare. While economic data can be broken down geographically, and issues about crime can be broken down by gender, there are no indicators which measure regional balance or violence against women and girls. This seems like a huge omission from the Dashboard.
Having indicators which are more closely linked to the nine priorities would improve the Dashboard and provide for a more cohesive view of what progress has been made against the Executive’s core aims. A number of current indicators, such as the proportion of adults who volunteer and the number of adults participating in arts and cultural activities, while important for society, do not have a significant link to the PfG.
5. A more strategic approach to using the Dashboard is needed
There is little information available about the Executive’s use of the Wellbeing Framework, and it receives little attention from politicians or the media. There is a wealth of data in the Dashboard, which the Executive had said previously would be used to track progress and adjust plans as required. It is surprising therefore that the Dashboard has been updated but without any public statement, analysis or commentary about what the indicators tells us about how life in Northern Ireland has changed over the past year. Obviously a huge amount of work has gone into developing and maintaining the Dashboard, so it would be good to see it being used more fully.